Moving Averages
Technical Analysis > Basics of Chart Patterns
Moving averages are one of the most widely used technical indicators by traders. A moving average is the mean or average closing price of a specified number of periods. For example, a 5 day moving average is calculated by adding the closing prices of the most recent 5 days and then dividing that total by 5. The usefulness of moving averages is the smoothing out of price action which is usually the result of volatility.
In technical analysis, moving averages are used to find out if conditions are bullish or bearish. The shorter-term moving average is normally used with a longer-term moving average. Usually, moving averages work best with trending prices. If prices have not discernible trend and move in an erratic manner, moving average may do multiple crossovers and and give false buy or sell signals. One can complement other technical indicators with the use of moving averages.
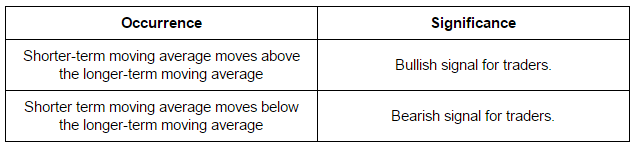
The table below shows the interpretation of moving averages.
How can option traders make use of moving averages?
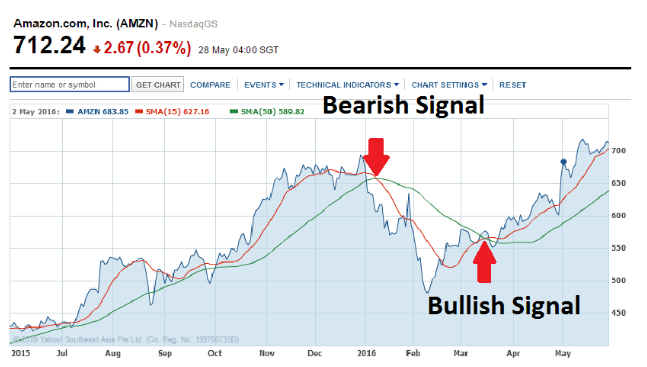
When the shorter-term moving average line goes above the longer-term moving average line, it is a signal to the options traders to execute a bullish option strategy. This is especially so in trending markets. When the shorter-term moving average goes below the longer-term moving average line, option traders can employ bearish option strategies.
Read:
Moving Average Convergence Divergence(MACD)