Volume Action
Technical Analysis > Basics of Chart Patterns
Volume refers to the quantity of traded units in a financial security such as a stock, commodity or futures. Many technical analysts rely on it as it is a telling indicator of demand and supply in a traded security. When the price of a security rises on low volume, it is sign that the move is unsustainable.
How to interpret price volume action?
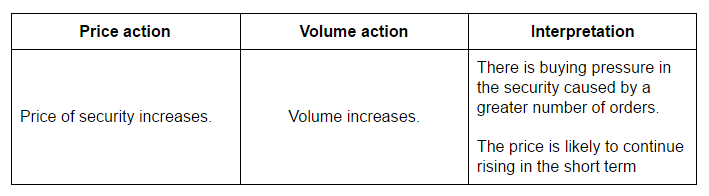
IMAGE OF PRICE n volumerising
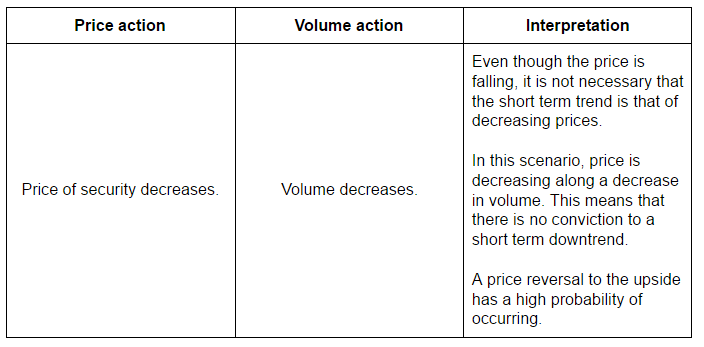
IMAGE of price moving down and volume moving down
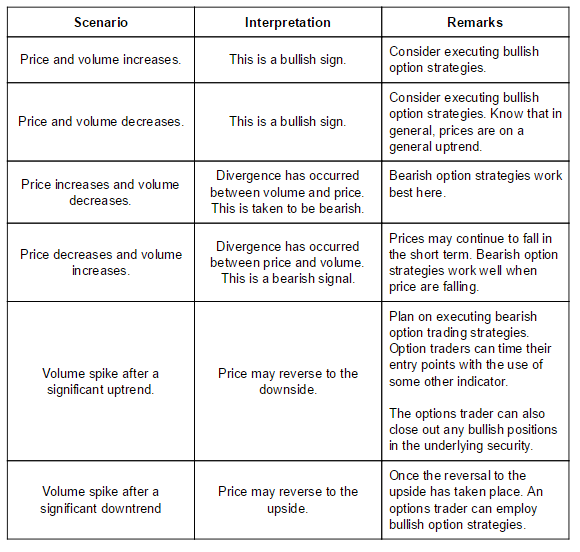
When the price of the security and volume moves together, that is taken to be a bullish sign as in the scenarios above.
Let us examine 2 more scenarios shown below.
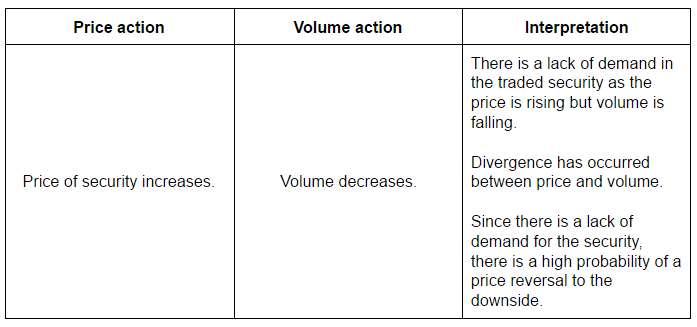
IMAGE of rising price and falling volume
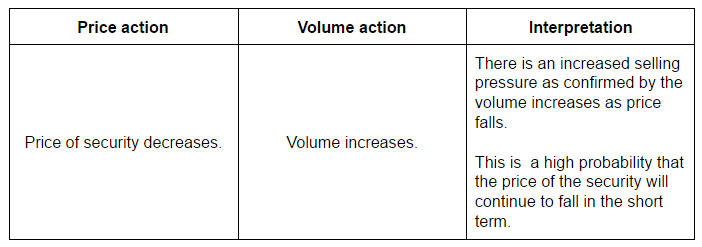
IMAGE of price falling with increasing volume>
When volume and price have a trend divergence as in the 2 scenarios above, it is a bearish sign.
Volume spikes
Volume spikes are sudden volume surges in a security after the security has trended for a lengthy period of time. After a lengthy uptrend, if a volume spike occurs, there may be a reversal in the price trend. On the contrary, after a lengthy period of downtrend and a volume spike occurs, the price may reverse to the upside.How can option traders make use of price-volume action?
Read:
Fibonacci Retracements